Physical trace on map from GPS track data
 With more and more people carrying personal tracking devices, a wealth of personal information is being collected that can be visualized or physicalized in different ways. The geospatial data that all of our phones – and more and more watches – collect is particularly amenable to rendering into physicalizations.
Below is a model of the path I took a few months ago as I ran a few errands around my home on Aquidneck Island. I made two stops and intentionally took a route that formed a loop with no overlapping segments. Continue reading
 This is my first foray into wearable electronics. It is a sound activated hat. There is a microphone below the bill of the hat that picks up the voice of the wearer as well as ambient noise. The sound is converted to light using a small board sewn into the back of the hat. The light patterns in the animated image to the left are random flashes triggered by sound. The intensity of each flash varies with sound level.

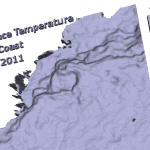 other 3D map. This one shows differences in sea surface temperature (SST) along the East Coast of the U.S. The elevation differences highlights the Gulf Stream, a surface current that flows north along the western edge of the North Atlantic, transporting warm water northward from the tropics.

 s of information can help people make emotional connections with the patterns and relationships contained in data. One way to create that emotional connection is to relate information to sizes and shapes people are familiar with from everyday life.