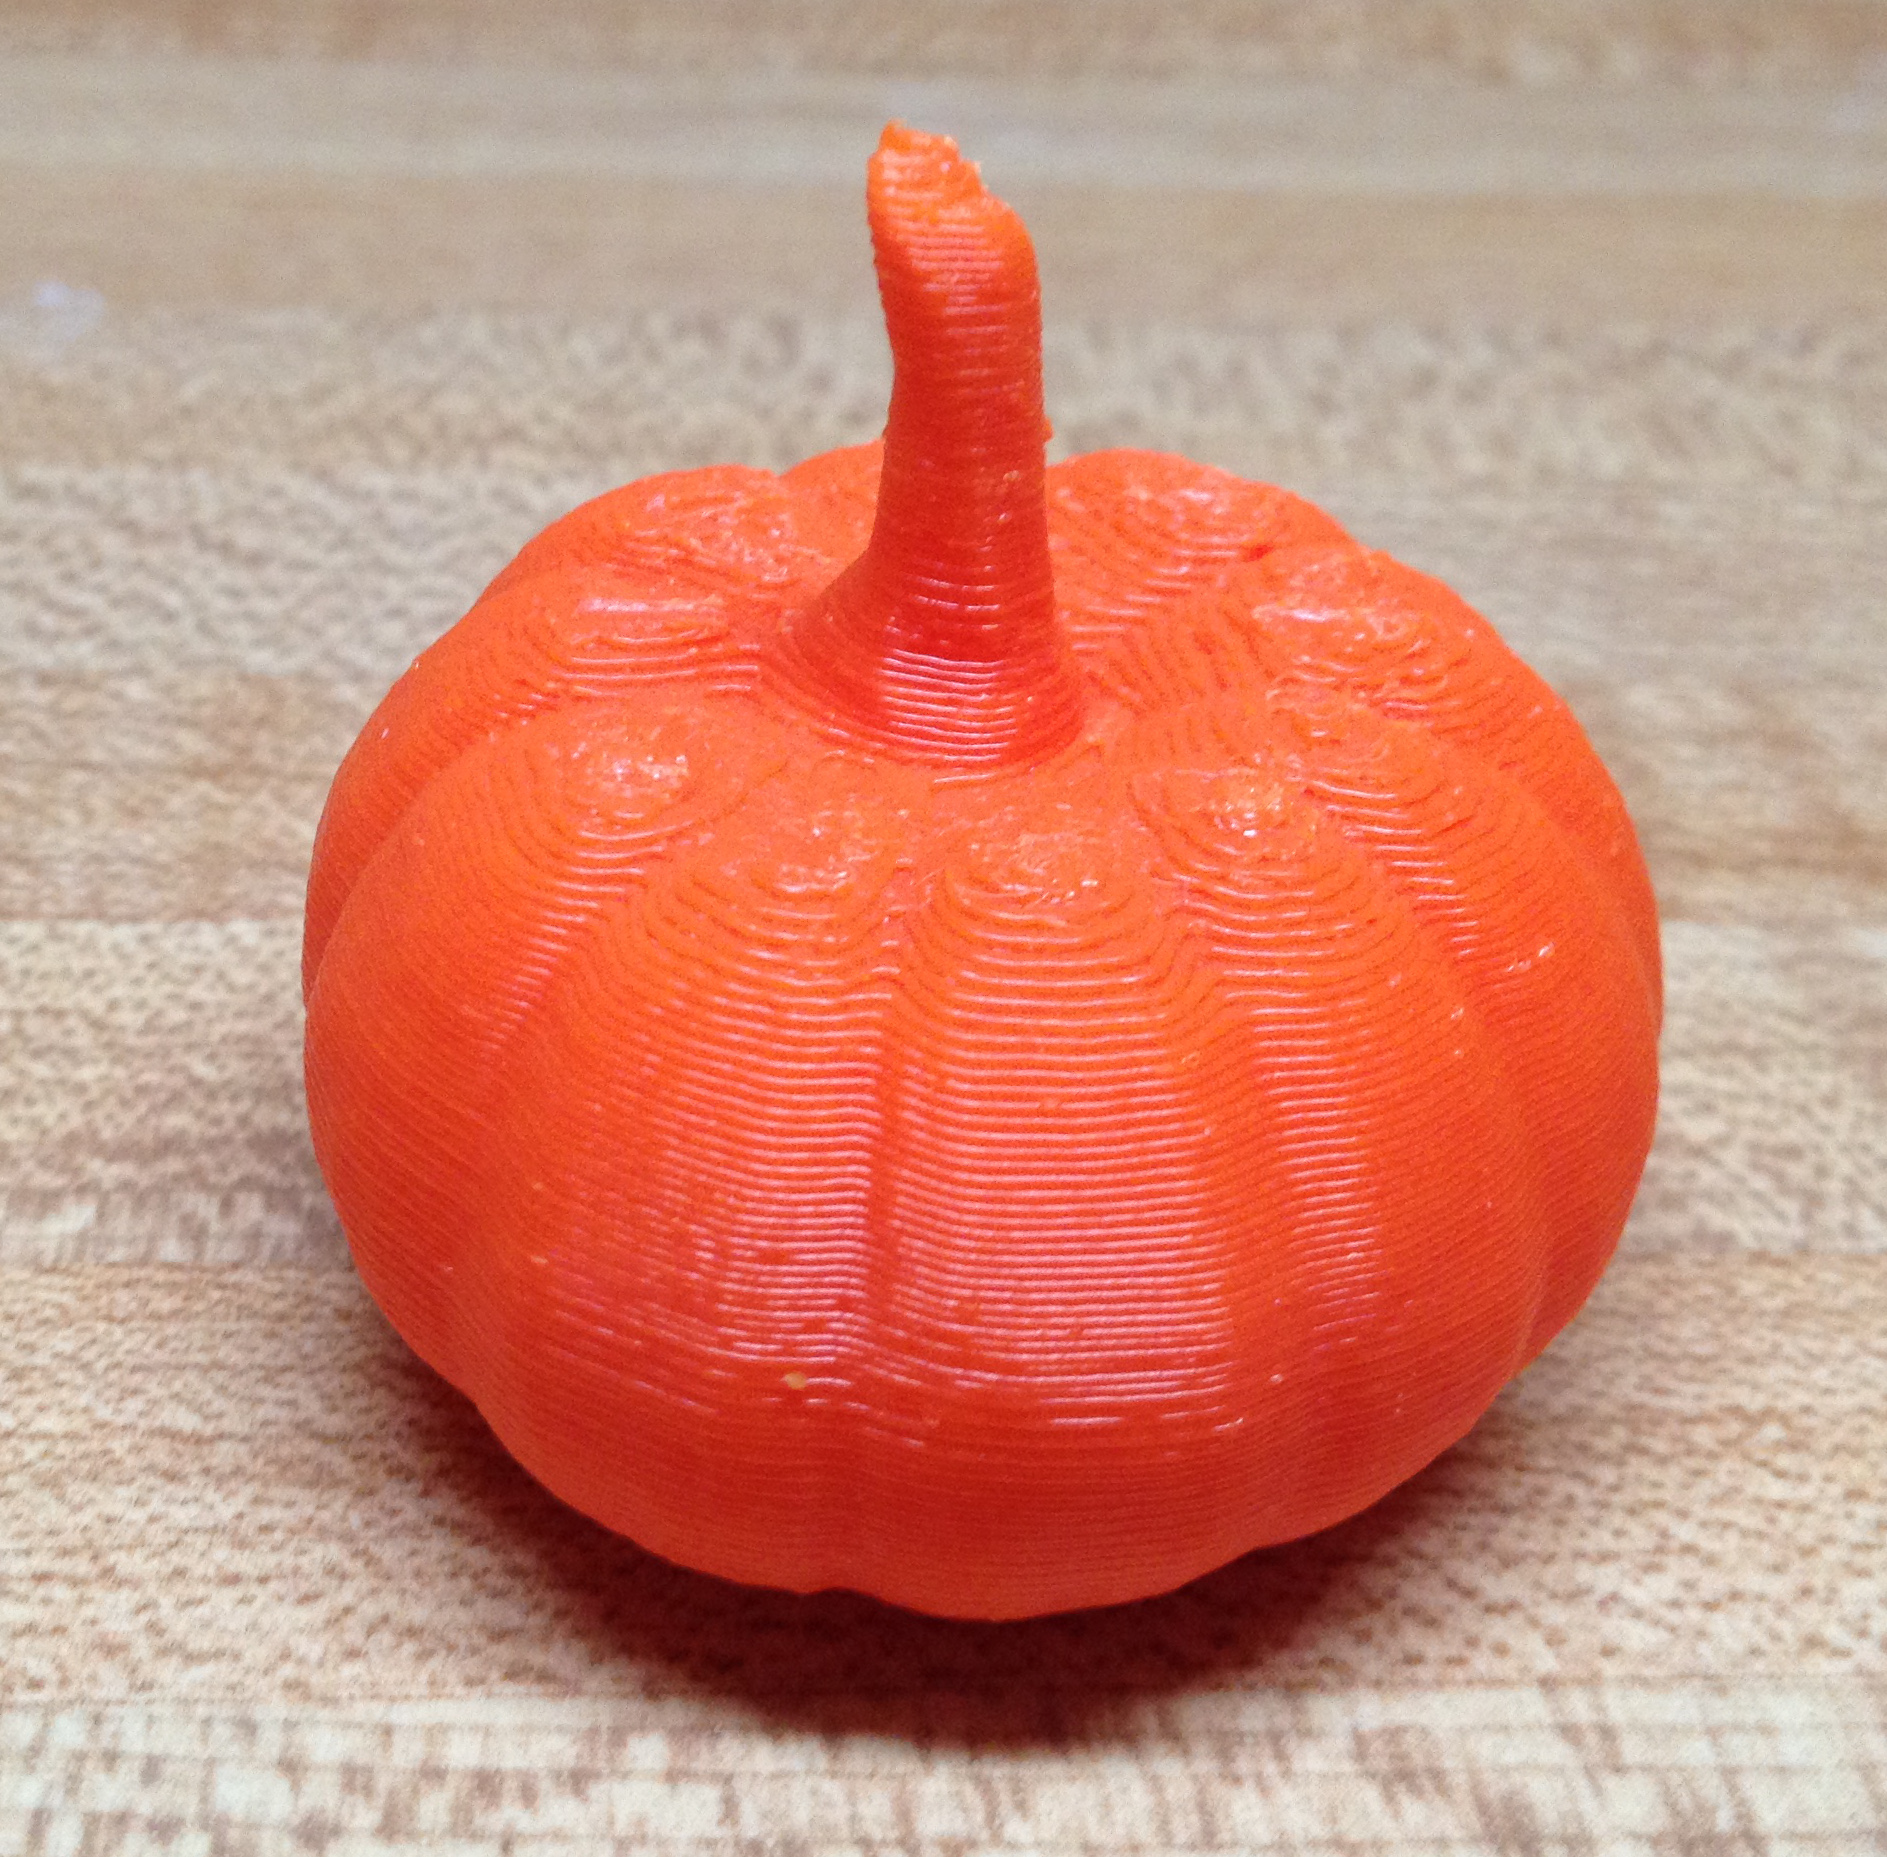
3D printed ornament contest entry
 Here is my entry for the 3DPPVD printed ornament contest.
I used a combination of Inkscape and Openscad to design it. It was printed on my Makerbot Replicator (1st gen) dualstrusion machine.
Here is my entry for the 3DPPVD printed ornament contest.
I used a combination of Inkscape and Openscad to design it. It was printed on my Makerbot Replicator (1st gen) dualstrusion machine.
 I am leading a discussion about 3D printing at my local library this evening. This is the summary of design resources I came up with: Continue reading
Bubble charts are a popular way to present quantitative data. Often the area of the circles in the bubble chart are used to encode the value of a parameter. The larger the value, the greater the area, the bigger the circle. This makes intuitive sense and can be quite effective for rough comparisons. However, it is important to understand that we are not very good at estimating area and these representations distorts the data because we are not very good at estimating area.
Continue reading
The Data, Information, Knowledge, Wisdom (DIKW) pyramid is often invoked to describe the value of information visualization. The suggestion is that by properly processing, sorting, and encoding ‘data’, it can move up a value pyramid from mere data to information (which is data made useful). Then, through some additional magical processes this information can become knowledge and ultimately contribute to wisdom.
While this description of the process of creating value from data has rhetorical charm, it does not stand up to close inspection. The problems comes from the fact that the meaning of the terms data, information, knowledge and wisdom are not consistent with their usage in this pyramid scheme. Continue reading
Over the past few years I’ve spend a part of my free time developing content for my science education site SciencePrimer.com. I was actively teaching when I launched the site and I used it to host material I created for my students. The motivation for the site came from the strong positive feedback I got (and continue to get) from students. The site contains short video lectures, problem sets, and calculators, but the interactive illustrations are at the heart of my efforts. Continue reading

Apalachicola-Chattahoochee-Flint River Basin
The Apalachicola-Chattahoochee-Flint River water basin (ACF Basin) extends across three states: Georgia, Alabama and Florida. The watershed is the focus of a long running water use dispute between stakeholders in these three states. This conflict is covered in the book “Water Diplomacy: A Negotiated Approach to Managing Complex Water Networks” by Shafiqul Islam and Lawrence E. Susskind. An early figure on the book (figure 2.1, page 11) uses a stacked timeline to show how the water use issues in the ACF Basin became more complex as the population in the region grew and the number of interested parties increased over time.
Continue reading
My daughter is studying the oceans and continents of the world in school. Looking at the static orthographic and mercator projections used in her worksheet gave me the idea to make a dynamic globe visualization showing location of a selection of continents and oceans.
 The photo on the left is a physical representation of the water on Earth scaled to fit on an Earth with a radius of 40 cm (about 15.74 inches).
The model is inspired by a graphic on the USGS website showing what all of the water on, in and above the Earth would look like if it was collected into a big drop and placed back on the globe. To give a sense of scale the image shows the spheres of water sitting in the middle of the continental U.S.
One version of the illustration give additional perspective by showing two smaller spheres. The larger of the two smaller spheres represents all of the liquid fresh water on Earth. The smallest contains only the water in lakes and rivers. This smallest sphere represents the majority of water used by humanity. The full description and context of the visualization is available on the USGS website.
The physical model above shows the same information. Each blue sphere is to scale. The largest one is all of the water on Earth. The mid-sized sphere is all fresh liquid water and the smallest is lake and river water only.
The white base is a small slice of a sphere equal to the size of the earth at the same scale.
The image below shows the three water spheres sitting on top of a sphere the size of the Earth at the same scale.

The files need to print this model are available on Thingiverse.
Our eyes give us a very subjective view of the world. This subjectivity leaves us susceptible to a variety of optical illusions. The fact that we are not very good at estimating the absolute brightness of a region, but have a strong ability to detect differences between neighboring regions causes simultaneous brightness contrast illusions. This type of illusion makes the perceived brightness of any region in a complex image vary depending on the brightness of the region’s immediate surroundings.
The illustration below shows how our perception of a solid grey square is influenced by the background. The two squares below are the same shade of grey, but the lighter background behind the square on the left makes that square appear darker than the one on the right.
Continue reading
This post was inspired by Moritz Stefaner’s remix of Hans Rosling’s fertility and life expectancy bubble graph from Gapminder.
Continue reading